Project Arquiberlab
Background and aims
Introduction to analytical techniques employed
Raman Spectroscopy (MRS)
X-Ray Florescence: EDXRF and WDXRF
X-Ray Diffraction (XRD)
Equipments and methodology
MRS
EDXRF
WDXRF
XRD
Digitation and 3D models
Database
Raw materials and colours of the Iberians: Evolution and types
Background and aims
Iberians are one of the most significant Iron Age cultures of the Iberian Peninsula. Their rich movable and immovable heritage, the coverage of their territory from Andalusia to Southern France along the Mediterranean basin and their extensive timeframe spanning from the 6th century BC to the 1st century BC bear witness to their relevance. Substantial progress has been made in the understanding of the Iberians because they were first described as a culture in the second half of the 19th century. Still, certain areas remain in need of further research, like the manufacture and decoration of archaeological materials. Identification of the decoration processes of Iberian materials, specifically concerning ceramics, has been attempted through the 20th century. Deeper analyses were made around the turn of the century, with an almost exclusive focus on the decoration of the major Iberian sculptures, e.g. the Lady of Baza (Figure 1), the Warrior of Baza, the Lady of Elche or the Lady of La Alcudia (Ferrero et al., 1999 y 2001; Gaitán et al., 1999; Ramos, 2002; Gómez et al., 2008 y 2010; Mielke, 2011). The instrumental techniques used in these cases were X-ray diffraction (XRD), energy dispersive X-ray fluorescence (EDXRF) and/or scanning electron microscopy.
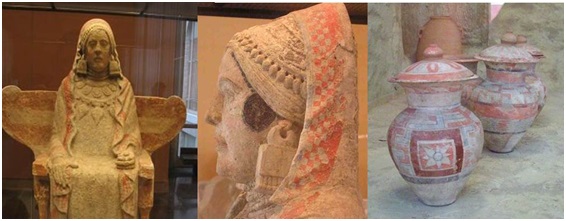
Figure 1. Left/Middle: Lady of Baza (Granada, Spain) excavated in the grave 155 of the Iberian cemetery of Cerro del Santuario). Right: Painted pottery of the grave 155 (Presedo 1973; Mielke 2011).
Micro-Raman spectroscopy (MRS) has been used for research on Iberian archaeological heritage since the beginning of the 21st century. In 2004, the University Research Institute for Iberian Archaeology (IAI, University of Jaén, Spain), the Department of Physical and Analytical Chemistry of the University of Jaén (Spain) and the Department of Archaeology of Ghent University (Belgium) launched a line on MRS-based research on archaeological items from Eastern Andalusia. Additional examples of the same type are the research on red decorated ceramics from the settlement of La Vispesa (Huesca) (Ayora et al., 2010) and from the oppidum of El Castillejo (Alameda, Málaga) (Compaña et al., 2012), or the research on Greek ceramics from the Iberian cemetery of Cabezo Lucero (Alicante) (Pérez y Esteve, 2004).
The IAI’s line of research aims at casting light on poorly known manifestations of Iberian culture: the raw materials that they used, their work processes and their decorations and pigments. Research is not limited to ceramics and includes other archaeological materials like decorated and undecorated coverings, glass paste and other stone items like sculptures and funerary urns. The analysis of these materials is intended to cover a timeframe spanning from the 7th century BC as the founding stage of the Iberian culture to its decline in the 1st century BC (Sánchez et al., 2012a, 2012b; Tuñón et al., 2016).
The second objective is the compilation of a catalogue and an online database to collect and supply archaeometric information about Iberian materials and decoration. Additional archaeological information and the techniques used for physicochemical analysis are added to the above. The database is intended as a tool for research on the making and decoration of Iberian objects. Whenever the conditions allow, 3D models of objects and structures are also made available with addition of physicochemical information.
Listed below are the bibliographical references, some cited in the text, that have been focus on the physical-chemical analysis of the decorations in various archaeological materials throughout the history of research on Iberians.
Antón, G.; Vila, R.; Vitoria, J. y Fernández J. I. (1972): “Contribución al estudio y clasificación de cerámicas ibéricas valencianas”. Boletín de la Sociedad Española de Cerámica y Vidrio, 11 (1): 47-55.
Ayora, M. J.; Domínguez, A. y Domínguez Vidal, A. (2012): “Raman Microspectroscopic study of Iberian pottery from the La Vispesa archaeological site, Spain”. Journal of Raman Spectroscopy, 43 (2): 317-322.
Cabrera, J. M. (1972): "Conservación y restauración de una escultura en piedra policromada del s. IV a.C.". Informes y Trabajos del Instituto de Conservación y Restauración de Obras de Arte, 12: 23-4.
Colominas, J. y Puig i Cadafalch, J. (1915-1920): “El forn ibèric de Fontscaldes”, Anuari de L’Institut D’Estudis Catálans, VI: 602-605.
Compaña, J. M.; León, L.; Capel, C.; Jorge, S. E.; Hernández, V. y García, M. A. (2012): “Archaeometric study of iberian pottery from “El Castillejo” (Alameda, Málaga, Spain)”. Estudos Arqueológicos de Oeiras, 19: 43-50
Gómez, Mª L.; Navarro, J.V.; Martín de Hijas, C.; Del Egido,; M. Algueró,; M. González, E. y Arteaga, A. (2008): “Revisión y actualización de los análisis de la policromía de la Dama de Baza. Comparación con la Dama de Elche”. Bienes culturales: revista del IPHE, 8: 211-222.
Ferrero, J. L.; Roldán, C.; Juanes, D. y Rovira, S. (2001): “Análisis EDXRF de pigmentos de la Dama de Baza (s. IV a.C.)”, en B. Gómez, M. A. Respaldiza y Mª L. Pardo (eds.): III Congreso Nacional de Arqueometría, Universidad de Sevilla y Fundación el Monte, Sevilla: 109-115.
Ferrero, J. L.; Roldán, C.; Ramos, R.; Ramos Molina, A. y Ramos Molina, R. (1999): “Análisis de pigmentos en escultura polícroma ibérica de La Alcudia (Elche)”. Actas del XXV Congreso Nacional de Arqueología. Valencia: 540-545.
Gaitán, J.; Ontiveros, E.; Martín, L. y Villegas, R. (1999): “Estudio analítico de los materiales de la escultura ibérica denominada El guerrero de Baza”, en C. San Martín y M. Ramos (eds.): El guerrero de Baza. Sevilla: 49–56.
Gómez, M.; Navarro, J. V.; de Martín, C.; del Egido, M.; Algueró, M.; González, E.; Arteaga, A. y Juanes, D. (2010): “La escultura de Baza: materias, pátinas y policromía”, en T. Chapa e I. Izquierdo (eds.): La Dama de Baza. Un viaje femenino al más allá. Actas del encuentro internacional Museo Arqueológico Nacional. Madrid, 27 y 28 de noviembre de 2007, Madrid: 103–117.
Luxán, M. P.; Prada, J. L. y Borrego, F (2005): “Dama de Elche: Pigments, surface coating and stone of the sculpture”. Materials and Structures, 38 (3): 419-424.
Martín, M. y Martínez, F. (1981): “Análisis de pigmentos en cerámica Ibérica”. Bajo Aragón Prehistórica, III: 89-90.
Mielke, D. P. (2011): “Die Polychromie iberischer Skulpturen”. Madrider Mitteilungen, 52: 306-332.
Parras, D. (2008): Análisis en contextos arqueológicos de Andalucía mediante microscopía Raman y Cromatografía de gases-espectrometría de masas. Tesis Doctoral. Universidad de Jaén.
Parras, D.; Montejo, M.; Ramos, N. y Sánchez, A. (2006): “Analysis of pigments and coverings by X-Ray Diffraction (XRD) and Micro Raman Spectroscopy (MRS) in the cemetery of Tutugi (Galera, Granada, Spain) and the settlement Convento 2 (Montemayor, Córdoba, Spain)”. Spectrochimica Acta A,64: 1133-1141.
Parras, D.; Sánchez, A.; Tuñón, J.; Montejo, M.; Ramos, N. y Cañabate, Mª. L. (2015): “Análisis físico-químicos en el santuario de El Pajarillo (Huelma, Jaén) y en el oppidum de Puente Tablas (Jaén)”, en A. Ruiz y M. Molinos (eds.): Jaén tierra ibera. 40 años de investigación y transferencia. Universidad de Jaén, Jaén: 137-144.
Parras, D.; Vandenabeele, P.; Sánchez, A.; Montejo, M.; Moens, L. y Ramos, N. (2010): “Micro-Raman spectroscopy of decorated pottery from the Iberian archaeological site of Puente Tablas (Jaén, Spain, 7th-4th century B.C.)”. Journal of Raman Spectroscopy, 41: 68-73.
Pérez, J.M. y Esteve, R. (2004): “Pigment identification in Greek pottery by Raman Microspectroscopy”. Archaeometry, 46: 607-614.
Ramos, A (2002): “Pie de dama de La Alcudia de Elche”. Bolskan, 19: 245-427.
Roldán, C.; Ferrari, J. L.; Primo, V.; Mata, C. y Burriel, J. (2005): “Analysis of Iberian wall paintings from “Tos Pelat” (4th century B.C.)”. Art '05. Proceedings 8th International Conference on Non-Destructive Investigations and Microanalysis for the Diagnostics and Conservation of the Cultural and Environmental Heritage, Lecce (Italy). Brescia : Associazione italiana prove non distruttive monitoraggio diagnostica, (CD-ROM format).
Sánchez, J. (1979): “Análisis del pigmento de la cerámica Ibérica de Fontscaldes (Tarragona)”. Bulletí Arqueológico de Tarragona, Época V, Núm. 1: 3-10.
Sánchez, J. y Ramírez, J. (1954): “El pigmento en la cerámica Ibérica”. Caesaraugusta, 5: 37-41.
Sánchez, A.; Parras D.; Montejo, M., y Ramos N. (2007): “Microscopía Raman en dos contextos arqueológicos de época orientalizante e ibérica”, en J. Molera; J. Farjas, P. Roura P. y T. Pradell (eds.): Avances en Arqueometría 2005, Universidad de Gerona, Gerona: 175-182.
Sánchez, A., Parras D. J, Tuñón, J.A. y Montejo, M. (2014). “Análisis de recubrimientos y pigmentos en la necrópolis ibérica de Tútugi (Galera, Granada)”, en O. Rodríguez Ariza: La necrópolis ibérica de Tutugi (2000-2012). Universidad de Jaén e Instituto Universitario de Investigación en Arqueología ibérica. Jaén. 349-368.
Sánchez, A.; Parras D.; Montejo, M., y Ramos N. (2008): “Análisis físico-químicos en las casas 6 y 7 del asentamiento ibérico de Puente Tablas, Jaén”, en S. Rovira; M. García-Heras; M. Gener, M. e I. Montero (eds.): VII Congreso Ibérico de Arqueometría. Madrid: 601-610.
Sánchez, A.; Parras D.; Montejo, M., y Ramos N. (2009): “Arqueología ibérica desde la química”, en Castro E. (Ed.) Proyectos de Investigación 2006-2007, Universidad de Jaén y Caja Rural, Jaén: 196-243.
Sánchez, A., Tuñón, J. A., Montejo, y Parras, D. J. (2012a): “Análisis de pigmentos a partir de microscopía Raman sobre materiales arqueológicos de la cultura de los iberos en la Alta Andalucía”. Boletín GRASECA, enero: 29-36.
Sánchez, A., Tuñón, J. A., Montejo, y Parras, D. J. (2012b): “Micro Raman spectroscopy (MRS) and Energy dispersive X-ray fluorescence (µEDXRF) analysis of pigments in the Iberian cemetery of Tútugi (4th-3rd century b. C., Galera, Granada, Spain)”. Journal of Raman Spectroscopy, 43 (11): 1788–1795.
Sánchez, A., Parras D. J., Tuñón, J.A., Rísquez, C., Rodríguez, Mª O. Montejo, M., Ramos, N., García, J. F. y Márquez, F. (2014): “Physical-chemical analysis for the research and the valorisation of the oppidum of Puente Tablas (Jaén, Spain)”, en M. A. Rogerio (ed.): Science, Technology and Cultural Heritage. Taylor & Francis Group. London.103–108.
Tuñón, J. A.; Sánchez, A.; Montejo, M.; Márquez, F y Parras, D. (2015): “Análisis de pigmentos en cerámicas ibéricas del oppidum de Los Turruñuelos mediante Microespectroscopía Raman”. La Segunda Guerra Púnica en la península ibérica. Baecula: arqueología de una batalla. Universidad de Jaén, Jaén: 465-471.
Tuñón, J.A.; Sánchez, A.; Parras D.; Vandenabeele, P. y Montejo, M. (2016): “Micro-Raman Spectroscopy on Iberian archaeological materials”. Journal of Raman Spectroscopy, 47 (12): 1514–1521
INTRODUCTION TO ANALYTICAL TECHNIQUES EMPLOYED
Raman Spectroscopy (MRS)
The Raman effect. A short introduction
When a beam of monochromatic electromagnetic radiation hits a material system, most of the incident photons will be dispersed in all directions of space without any change in its frequency. This phenomenon of elastic dispersion of light is known as Rayleigh diffusion and is responsible for that we see the blue sky during the day or reddish at dusk. However, as a result of the atoms forming any system are continuously vibrating, a small portion of the incident light (1 in 10,000,000 photons) will undergo a frequency change and will be dispersed at frequencies other than the incident (minor or major). This phenomenon, predicted theoretically by Smekal in 1923, was first observed and justified by Sir Chandrasekhara Venkata Raman, which earned him the Nobel Prize for Physics in 1930.
Thus, the so-called Raman effect consists in the inelastic dispersion that a small fraction of the electromagnetic radiation suffers when interacting with matter. Some radiation will be dispersed with greater (anti-Stokes radiation) or smaller (Stokes radiation) frequencies. In the simplest possible case, a monochromatic radiation beam hitting a homonuclear diatomic molecule (see the figure below), the difference between the incident (ν0) and the scattered frequency (Raman shift) will coincide with the frequency of the vibrational motion ( in the figure νm) (Figure 2).
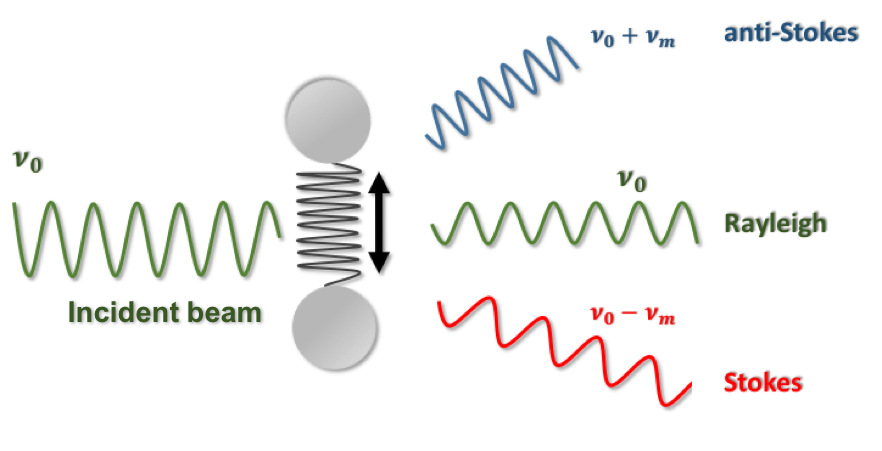
Figure 2. Scheme of Raman effect.
Raman Vibrational Spectra
In polyatomic systems a number of molecular vibrations will be possible. In fact, for a non-linear polyatomic molecule, there will be 3N-6 of the so-called normal modes of vibration (N being the number of atoms) each of which will have a specific frequency (energy) depending on the nature of the atoms involved and their spatial distribution (interatomic distances, bond angles, etc.).
The so-called vibrational spectrum of a system is formed by the set of specific values of these vibrational frequencies, which are comprised in the infrared region of the electromagnetic spectrum and constitute what is commonly known as its "fingerprint". It is characteristic of each system (even of each conformation of a given system) and its detailed analysis will allow, in the best case, its unequivocal identification.
There are several types of vibrational spectra, that can be measured experimentally by different techniques and that are based on different mechanisms of interaction of electromagnetic radiation with matter. Avoiding a detailed discussion of their differences and similarities, it can be said that the measure of the Raman scattering of a monochromatic light beam hitting a material system, allows obtaining a kind of vibrational spectrum, the Raman spectrum.
Measurement of the Raman spectrum
In summary, when a beam of monochromatic radiation (usually a laser) irradiates a sample, a small amount of the irradiating photons will be dispersed with frequencies (energies) other than the incident. The observed Raman shifts, which are the frequency differences between the incident and scattered photons, are not arbitrary, but rather coincide with the value of the vibrational frequencies of the system. The measurement of the number of photons scattered at each frequency will allow the so-called Raman spectrum to be obtained. Under these lines is shown a basic scheme of the experimental setup necessary to measure a Raman spectrum (Figure 3).
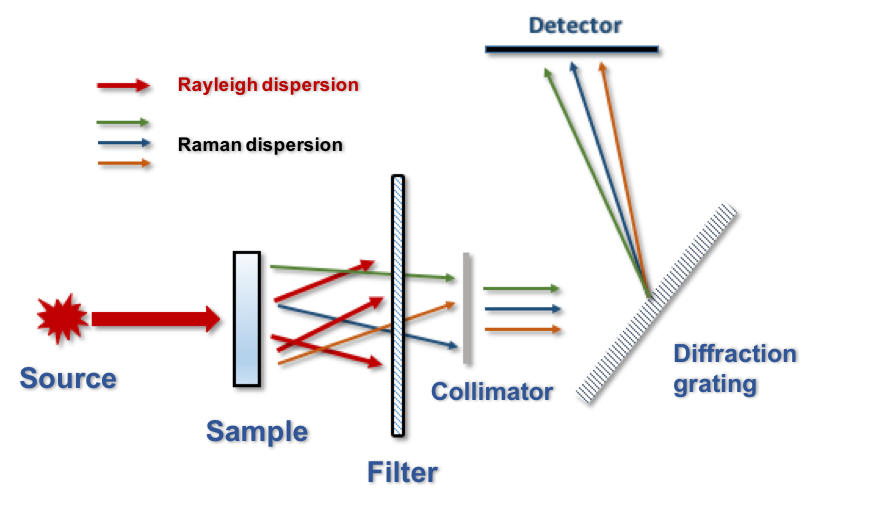
Figure 3. Basic scheme of the experimental setup needed to measure a Raman spectrum.
After the laser radiation is applied to the sample, the Rayleigh radiation (elastically dispersed) is removed using an optical filter. Then, Raman radiation is selected according to its frequency with a monochromator (usually a diffraction grating or a holographic filter) and is driven to a detector that "counts" the number of photons scattered at each frequency. After the mathematical treatment of the data, a set of peaks (bands) will be obtained, the position (Raman shifts) and relative intensities of which will inform about the molecular structure of the species.
It is worth to mention that the so-called Stokes radiation (the one scattered with a lower frequency than the incident radiation) is more commonly collected and analyzed since it is more intense than the anti-Stokes radiation. Besides, as Raman scattering occurs in all directions of the space, it is possible (and often common in commercial devices) that the collection of scattered light occurs at an angle of 180° to the incident beam (backscattering), in contrast to what is shown in the figure (the collection of scattered radiation occurs at 0o).
Raman Microscopy
Although Raman spectroscopy can be used for solid, liquid and gas samples (using the appropriate experimental equipment), the so-called Raman microscopy (MRS) is one of the most widespread sampling techniques nowadays.
The MRS technique was born in the late 60's of the last century, when Delhaye and Migeon integrated optical microscopy systems into Raman spectrometers. This “marriage” is enabled by two circumstances: (i) the intensity of the Raman signal obtained will not depend on the sampled area; (ii) both techniques (optical microscopy and Raman spectrometry) are compatible with a geometry of 180° between the observer and the sample.
The radiation source is a laser. In fact, the boom in experimental use of Raman spectroscopy (in general) and Raman microscopy (in particular) coincides with the development and commercialization of laser excitation sources.
The most common lasers in commercial devices are the diode (785 nm) and the Ar+ (514.5 nm). The selection of the laser will condition the equipment's optics: the filters and the diffraction grating must be exchanged when a new source is selected. Generally the longer wavelength source is indicated for samples that are more susceptible to photo-deterioration (such as biological samples). The shortest wavelength source is usually indicated for the study of mineral samples. In any case, the use of these (or others) will be conditioned by the nature of the sample to be studied, bearing in mind that a compromise has to be reached between the potential improvement in the so-called signal-to-noise ratio produced by increasing the laser power and the risk of possible photo-degradation.
The choice of the laser will be also influenced by the possible occurrence of fluorescence, which is the largest interferer in Raman spectroscopy and whose appearance will depend on the frequency of the incident radiation.
As can be seen in the figure 4, the laser is sent to the sample and the dispersed radiation is collected through the objective of the microscope (backscattering). The collected radiation is passed through a filter that will remove Rayleigh radiation and is driven to a diffraction grating and from there to the detector. In this regard, it is important to note that the development and implementation of CCD cameras (which are highly sensitive and operate at room temperature) as Raman detectors has also been crucial for the development of different techniques based on this phenomenon.
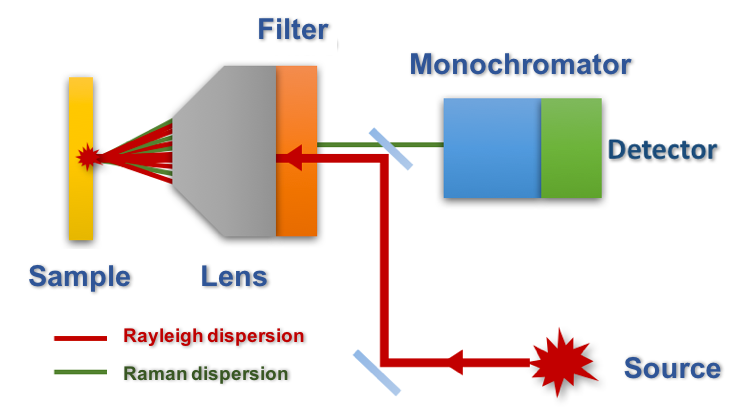
Figure 4. Simplified scheme of a Raman microscope.
Using Raman Microscopy in Archeology
The convenience of using the MRS for the analysis of materials of historical-artistic interest is obvious considering the main attributes of the technique.
Firstly, a Raman microscope will allow focusing the laser beam to very small regions, adding to the exceptional selectivity intrinsic to the spectroscopic technique, a high spatial resolution (which can be in the order of tenths of a micron). This makes it possible to address the analysis of heterogeneities within a complex sample (for example, pigments).
Another advantage is the recent development of MRS portable devices, which offer a remarkable performance and allow field measurements, enabling the transfer of the laboratory to the sample, which can be of great interest to carry out measurements in archaeological sites and / or museums, avoiding sampling and transportation.
Finally, and as the most important feature for these purposes, it is a non-destructive technique and does not require a previous step of sample preparation beyond the cleaning of the surface of the studied sample. This allows different (microscopic) regions of the same sample to be measured repeatedly, varying the experimental conditions until a good quality record is obtained without the sample being damaged.
There are many examples in the scientific literature of application of the MRS technique for the identification of raw materials used in the manufacturing of artifacts of historical and artistic interest. The results obtained may help in restoration processes or authenticity studied, for example. Furthermore, the use of the MRS technique, in the context of an archaeometric and multidisciplinary investigation, can serve to shed light on studies focused on the dating of certain artifacts, the identification of trade routes or the determination of the level of technological development in certain historical moments.
References:
Bersani, D.; Conti, C.; Matousek, P.; Pozzi, F. and Vandenabeele, P. (2016): Methodological Evolutions of Raman Spectroscopy in Art and Archaeology. Analytical Methods, 8: 8395-8409.
Ciliberto, E. and Spoto, G. (eds.) (2000): Modern Analytical Methods in Art and Archaeology. Wiley-Interscience. New York (USA).
Ropret, P. and Madariaga, J.M. (2014): Applications of Raman Spectroscopy in Art and Archaeology. Journal of Raman Spectroscopy, 45: 985-992.
Turrell, G. and Corset, J. (eds.) (1996): Raman Microscopy. Development and Applications. Elsevier. London (UK).
Vandenabeele, P. and Donais, M.K. (2016): Mobile Spectroscopic Instrumentation in Archaeological Research. Applied Spectroscopy, 70: 27-41.
X-Ray Fluorescence
When X-rays produced by a source irradiate an atom, particles such as X-ray photons and electrons with sufficient energy can expel an electron from the atom (Figure 5). This produces a vacancy in a shell putting the atom in an unstable excited state with a higher energy. The atom restores the original configuration by transferring an electron from an outer shell such as the L-shell to the vacancy in the K-shell. An L-shell electron has a higher energy than a K-shell electron, and when an L-shell electron is transferred to the K-shell, the energy surplus can be emitted as an X-ray photon. In an X-ray fluorescence spectrum, this is seen as a line. Each atom has its specific energy levels, so the emitted radiation is characteristic of that element. An atom emits more than a single energy (or line) because different holes can be produced and different electrons can fill these. The collection of emitted lines is characteristic of the element and can be considered a fingerprint of the element.
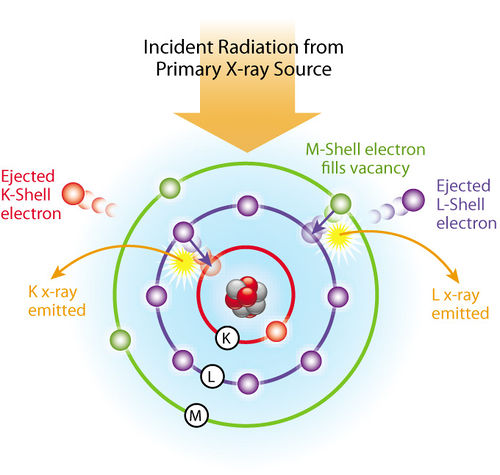
Figure 5. Scheme of X-ray fluorescence effect.
The elements present in a complex sample will emit fluorescent X-ray radiation with discrete energies that are characteristic for these elements. By measuring the energies of the radiation emitted by the sample it is possible to determine which elements are present. Moreover, the abundance of each element is present in the sample can be determined by measuring the intensities of the emitted energies.
The precision and the reproducibility of XRF analysis are very high. Very accurate results are possible when good standard specimens are available, but also in applications where no specific standards can be found. The measurement time depends on the number of elements to be determined and the required accuracy, and varies between seconds and minutes. This analytical technique is fast, accurate and non-destructive, and usually requires only a minimum of sample preparation.
X-ray fluorescence spectrometer systems can be divided into two main groups: energy dispersive systems (EDXRF) and wavelength dispersive systems (WDXRF). EDXRF system separates the X-rays according to their energies. The x-rays are directed to the detector which converts X-ray energy into voltage signals. Each energy is characteristic for each chemical element and its frequency of appearance is characteristic for its concentration. On the other hand, a wavelength dispersive detection system physically separates the X-rays according to their wavelengths. The X-rays are directed to an analyzing crystal which diffracts the X-rays in different directions according to their wavelengths, and then they pass to the detector (Figure 6, table 1).
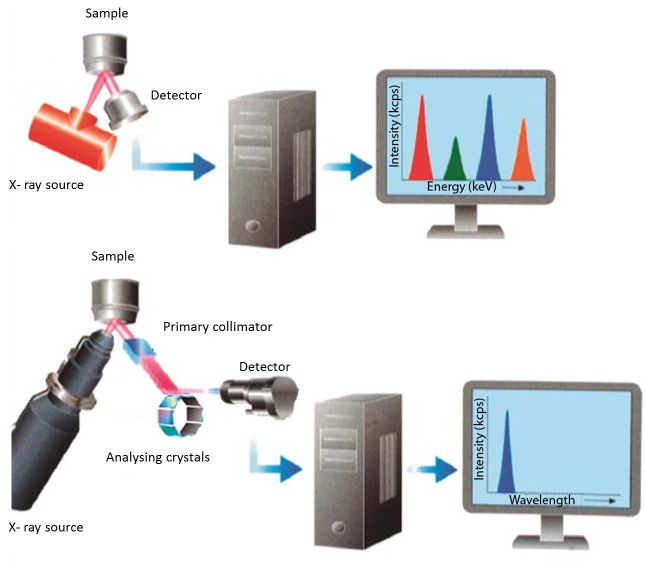
Figure 6. Schematic designs of EDXRF (top) and WDXRF (bottom) spectrometers.
Both of them have advantages and disadvantages which are summarised in next table:
Parameters | EDXRF | WDXRF |
Elemental range | From sodium to uranium | From beryllium to uranium |
Detection limit | Less optimal for light elements. Good for heavy elements | Good for beryllium and all heavier elements |
Sensitivity | Less optimal for light elements. Good for heavy elements | Reasonable for light elements. Good for heavy elements |
Resolution | Less optimal for light elements. Good for heavy elements | Good for light elements. Less optimal for heavy elements |
Measurement | Simultaneous | Sequential / Simultaneous |
Interferences | Ceramic matrix effect in the analysis of decoration | |
Table 1. Advantages and Disadvantages of EDXRF and WDXRF
References:
Brouwer, P. (2010): Theory of XRF. Getting acquainted with the principles. PANalytical B.V. Almelo (The Netherlands)
Shackley, M.S. (2011): X-ray fluorescence spectrometry in Geoarchaeology. Springer. New York (USA).
X-ray Diffraction (XRD)
The main target of X-ray diffraction by crystals is to know the particular condition in which the scattered X-rays from atoms and the incident X-rays are completely in phase and reinforce each other to produce a detectable diffraction beam. In other words, we have to find the common relationship that the differences in path length between X-rays scattered from crystals and that of the incident X-rays is an integer multiple of wavelength λ. For this purpose, the most important and familiar method is given by Bragg law which incorporates Bragg angle. In order to facilitate the understanding of Bragg’s law, it is required to remember the following two geometric relationships (Figure 7):
1. The angle between the incident X-ray beam and the normal to the reflection plane is equal to that between the normal and the diffracted X-ray beam. The incident X-ray beam, the plane normal, and the diffracted X-ray beam are always coplanar.
2. The angle between the diffracted X-ray beam and the transmitted one is always 2θ, and this angle is called “the diffraction angle.”
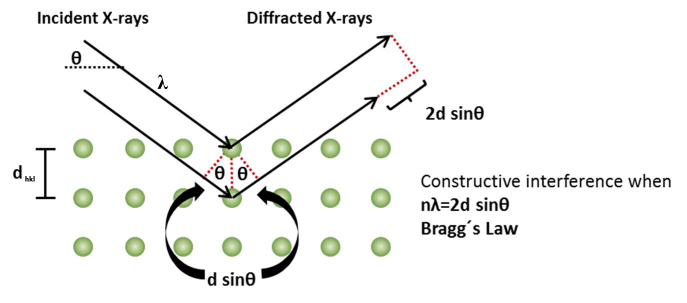
Figure 7: Scheme of X-ray diffraction.
If the incident X-rays of wavelength (λ) strike a crystal where all atoms are placed in a regular periodic array with interplanar spacing dhkl, diffraction beam of sufficient intensity is detected only when the “Bragg condition” or “Bragg’s law” is satisfied. For this process to take place, two requirements are needed:
- A spacing or distance between the layers of atoms that is approximately the same as the wavelength (λ) of the incident radiation
- Dispersion centers must be distributed in space on a regular basis
In order to know this phenomenon, it is necessary to know the Bragg’s Law which says: "when a narrow beam of X-rays collides with the surface of the crystal, the dispersion takes place as a consequence of the interaction of the radiation with atoms "(Skoog and Leary, 1994).
This physical-chemical technique is based on passing an X-ray beam through a crystal, which splits in several directions due to the grouping of atoms in the sample that is irradiated, giving rise to a set of intensities that can be interpreted according to the location of the atoms in the crystal.
X-ray diffraction provides a suitable and practical means for the qualitative identification of crystalline compounds. Among the methods that exist: the Laue method, that of the monocrystal and that of the crystalline powder, the latter is the only analytical method capable of providing qualitative and quantitative information on the compounds present in a solid sample. This method is based on the fact that each crystalline compound gives a single diffraction figure. Thus, if an exact fit can be found between the figure of an unknown sample and a real sample, its chemical identity can be assumed.
On the other hand, in powder X-ray diffraction, the sample consists of an infinitely large number of small crystallites, ideally randomly oriented with respect to each other. Because all orientations are present, it is only necessary to vary the angle of incidence and the angle of diffraction (Figure 8).
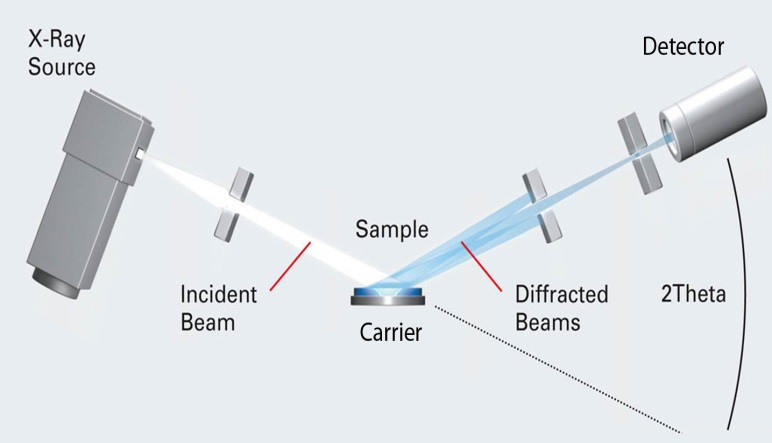
Figure 8. Schematic diagram of X-ray powder diffractometer
As a final conclusion and main advantages, X-ray diffraction (XRD) is a versatile and non-destructive analytical method for analysing ceramic and building materials of archaeological origin.
References:
Ermrich, M. y Opper, D. (2013): X-Ray powder diffraction. Getting acquainted with the principles. PANalytical B.V. Almelo (The Netherlands).
He, B. B. (2009): Two-dimensional X-Ray Diffraction. Wiley. Hoboken (New Jersey, USA).
Rodríguez Gallego, M. (1982): La difracción de rayos X. Alambra. Madrid (Spain).
Skoog, D. A. y Leary, J. J. (1994): Análisis Instrumental. McGraw-Hill. Madrid (Spain).
Waseda, Y., Matsubara, E., Shinoda, K. (2011): X-Ray Diffraction Crystallography. Introduction, examples and solved problems. Springer. Berlin (Germany).
Equipments and methodology
MRS
Micro-Raman spectroscopy relied on laboratory and portable Raman systems. The portable equipment proved especially useful for whole ceramic vessels and also for large and irregularly shaped ceramics.
The smaller items were studied with a Renishaw ‘in via’ Reflex Spectrometer coupled with a confocal Leica DM LM microscope (CICT, University of Jaén, Spain), equipped with a diode laser (785 nm, 300mW), and a Peltier-cooled CCD detector, calibrated to the 520.5 cm-1 line of silicon (Figure 9). The spectra were acquired using the 50× objective, in the 100 to 2000 cm-1 region, with spectral resolution of ~1 cm-1. This device consists of two gratings of 1200 and 1800 lines per millimeter for 785-nm and 514-nm lasers, respectively.Acquisition time was set between 10 and 60 s per accumulation, and the maximum number of accumulations was 30. In order to reduce the fluorescence effect during the analysis, some samples were irradiated by laser for a period of time between 50 and 600 s. This is known as bleaching time.
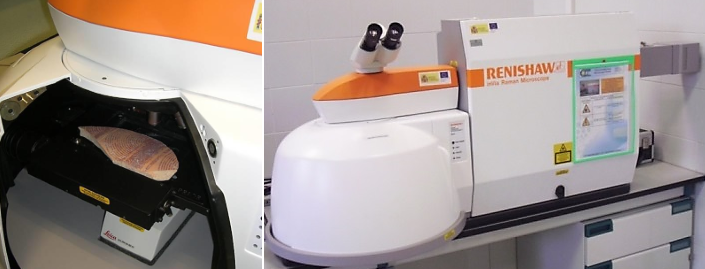
Figure 9. Laboratory MRS.
The portable equipment used was a BWS445-785S innoRam™ Raman spectrometer (IUIAI, University of Jaén, Spain) with a 785nm excitation laser (maximum power of 300mW) and a 4.5 cm-1 spectral resolution. The Raman microprobe can be mounted on a tripod with motorized XYZ axis (MICROBEAM S.A.) or on a microscope sampling stage (B&WTEK, Inc.) (Figure 10). The measurements were carried out with a 50× objective. Experimental conditions were as follows: exposure time ranged from200 to 1000ms, maximum 30 acquisitions and a spectral range between 60 and 3000 cm-1.
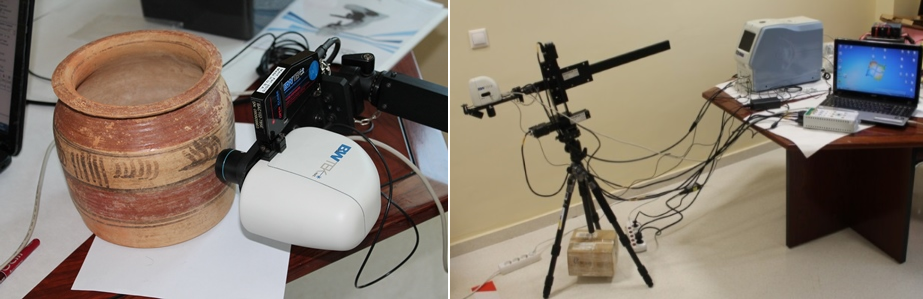 Figure 10. Portable MRS.
The maximum laser output power was eventually reduced in both equipments by using neutral density filters. The laser power ranged, depending on types of materials, between 150 mW for some coverings and 3 mW for black decorations in ceramics.
EDXRF
An EDAX (model Eagle III) fluorescence spectrometer was used for this research (CITI, University of Seville, Spain) (Figure 11). This spectrometer is equipped with a microfocus X-ray tube with an Rh anode, a polycapillary lens for X-ray focussing and an 80 mm2 energy dispersive Si-(Li) detector cooled by liquid nitrogen. The sample chamber incorporates an XYZ motorized stage for sample positioning. A high-resolution microscope (100x) is used to position the sample on the desired distance from the polycapillary. The dimensions of the cylindrical chamber are 330 (diameter) and 320 mm (depth), accepting samples up to 250 × 200 × 90 mm (XYZ). However, the real dimensions of the analysing stage are 100 × 85 × 90 mm (XYZ). To increase the sensitivity of the low Z elements, the sample chamber can be brought under vacuum. It allows for detecting elements between Na and U.
For the analysis of the samples, a spot size of 300 µm was chosen at an operating X-ray tube voltage of 40 kV. The tube current was adapted for each sample in order to optimize the detection of X-rays. Intensity range was between 610 and 980 µA.
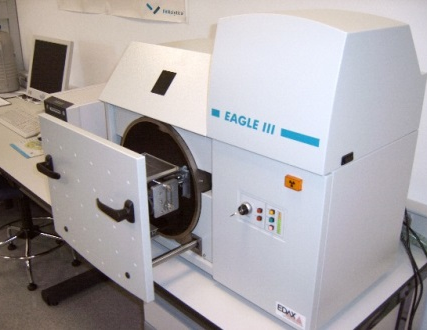
Figure 11. EDXRF spectrometer (model Eagle III, EDAX)
WDXRF
Solid samples measurements were performed with an AXIOS Panalytical wavelength dispersive X-ray fluorescence (WD-XRF) spectrometer owned by the Center for Innovation and Technological Research in the University of Seville (CITIUS) (Figure 12). The main features of the device include:
-Rh anode (4.4 kW maximum power)
-3 collimators (150 µm, 300 µm and 700 µm)
-6 analyzer crystals (LIF200, LIF 220, PX-10, Ge111, PE002, PX-1) that allow qualitative and quantitative chemical analysis of elements from O to U in a wide range of concentrations (from main components to traces).
-A flow detector (for Z ≤ 29 elements) and a scintillation detector (for Z > 29 elements).
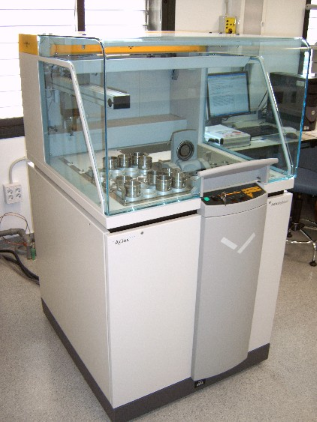
Figure 12. WDXRF spectrometer (model AXIOS, PANalytical)
The sample (about 0.1 g of pulverized solid) is prepared as a pressed pellet (10 mm diameter) using wax as a binder or a boric acid mold and placed in an vacuum chamber ( <10 Pa) for analysis.The method used allows the measurement of main elements (SiO2, Al2O3, MnO, MgO, CaO, Na2O, K2O, TiO2, P2O5 and SO3 in%) and trace elements (Cl, Sc, V, Cr, Co, Ni, Cu, Zn, Ga, Ge, As, Se, Br, Rb, Sr, Zr, Nb, Mo, Ag, Cd, Sb, Te, I, Ba, La, Nd, Sm, Dy, Er, Yb, Hf, Ta, W, Hg, Tl, Pb, Bi, Th and U in ppm).
XRD
During this research powder diffraction (XRD) was performed. The samples were ground to powder in an agate mortar until an adequate particle size (0.25 mm) and weighed approximately 1 g. The analyses were carried out by C.I.C. of University of Granada (Spain), using a BRUKER D8 ADVANCE diffractometer equipped with a copper tube, 2θ geometry and with a LYNXEYE Detector (Figure 13). Diffraction data were collected in the range of 2θ Bragg angles from 5° to 80° in 0.02° steps, step time 0.2 s. Peaks were identified with the Software Package Xpowder Plus and with reference manuals.
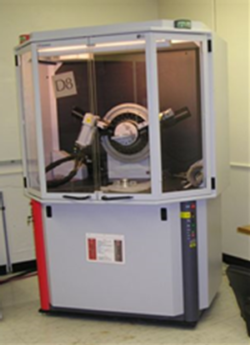
Figure 13. Diffractometer Bruker D8 Advance.
Digitization and 3D models
Digitization of Iberian objects and structures relies mainly on convergent photogrammetry. This technique is especially convenient for heritage recording, restoration and rehabilitation, because it yields highly accurate 3D models even with limited resources: It can use optical or digital cameras, and it only needs a high performance computer equipped with the adequate software, i.e. it does not need a restitutor. Photographs are taken fast too, so it does not depend on specific planning and thus stands out as a fast and easy method.
Software. The software used are Agisoft’s Photoscan and Autodesk’s Memento Beta. These software packages generate high quality 3D models from images based on 3d multi-vision reconstruction technology. This algorithm reconstructs 3D models from images taken by a series of known camera viewpoints. Data processing comprehends the following stages:
1.- Photography alignment
2.- Camera calibration
3.- Feature detection
4.- Mesh projection
5.- Texture mapping
6.- Texture repair
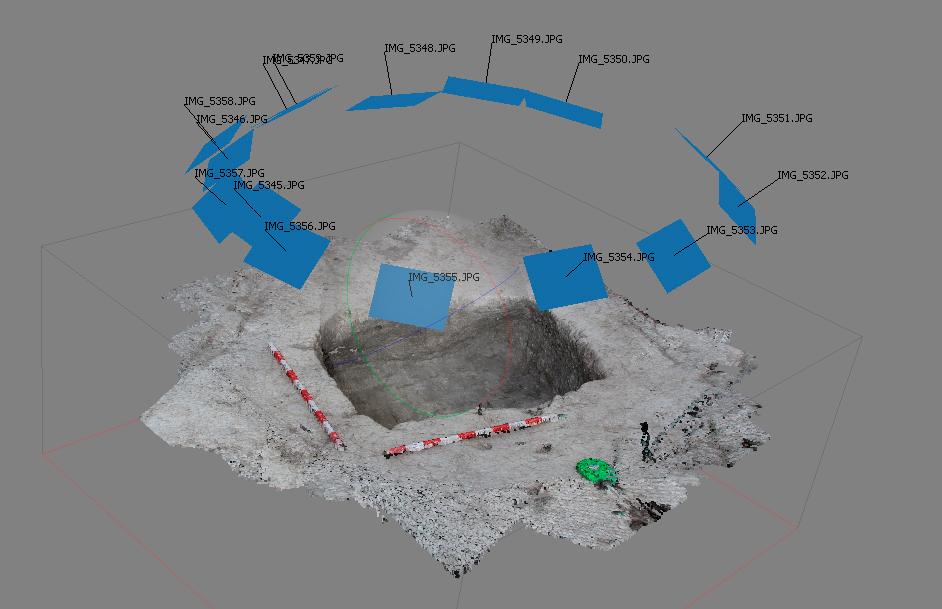
Figure 14. Position of the camera. Structure 12. Cerro de las Albahacas (Jaén, Spain)
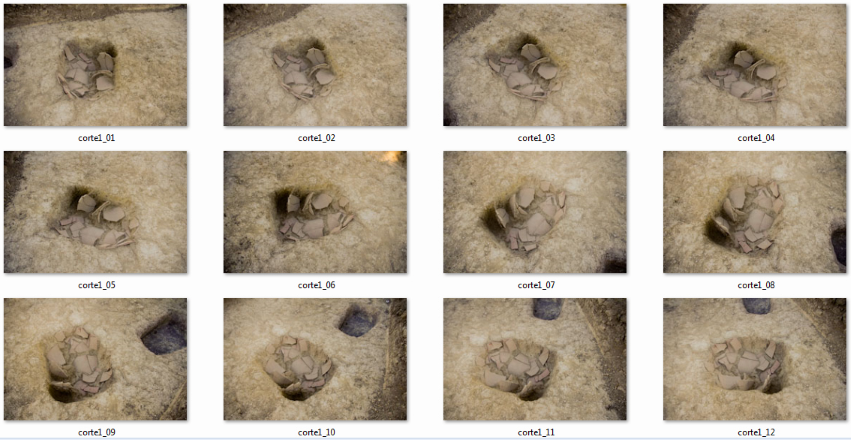
Figure 15. Photographs for the 3D model of a structure of Cerro de La Albahacas (Santo Tomé, Jaén, Spain)
The last stage is model conversion to an accessible format. At present, Sketchfab (sketchfab.com) is probably the best platform to edit, visualize and share 3D contents online. Sketchfab supports a WebGL-based 3D model viewer capable of reproducing 3D models both in desktop and mobile modes. Sketchfab’s 3D viewer uses a JavaScript API WebGL for display of 3D models. Its design is based on the open library OSG.JS code. Skechfab’s 3D viewer works in all browsers and all operating systems (Windows, Mac, Linux, iOS and Android). No plugin is required.
Database
Open-access database and website for researchers and non-specialized users. The database is hosted by the IAI’s server at the Scientific Computing Center of Andalusia (CICA). As the Center is run by the Regional Government of Andalusia (Junta de Andalucía), the technical support is guaranteed.
The structure of the database follows the CARARE metadata scheme (v.2.01) developed by the European-funded projects CARARE and 3D-ICONS (http://www.carare.eu/ http://3dicons-project.eu/).The design is based on previously existing standardized metadata schemas (MIDAS, LIDO) and is compatible with CIDOC CRM.
CARARE’s schema (v.2.01) focuses on the accurate description of archaeological heritage, on the events and studies in which it has been involved, and on the digital resources that represent the heritage and supply information about the heritage. Its main strength lies in the wide range of descriptive information that it can supply about monuments, buildings, objects, landscapes, and on its 2D and 3D recreations. The schema comprehends four main categories:
- Heritage Asset: This includes archaeological monuments, historic buildings, industrial monuments, archaeological landscape areas, shipwreck, artefacts and ecofacts, as well as books, printed materials, printed maps, drawings, photographs, films and born-digital 3D models which relate to the archaeological and architectural heritage.
- Digital resource: This includes the heritage-related images, drawings, plans, maps, files, publications and online 3D models.
- Collection information: This describes the collection which holds the contents provided.
- Activity: This includes historical events which took place at the heritage assets (such as building, alternation, demolition, battles, etc), archaeological events (such as excavations, surveys, etc) and analyses on the structures and objects (physicochemical, geological, biological) including the methods, techniques and equipments used.
As the metadata can be transformed to EDM (Europeana Data Model) format and also be normalized for use by Europeana’s website (www.europeana.eu), the CARARE schema allows to export the database to the European Digital Library (Europeana).
Raw materials and colours of the Iberians: Evolution and types
Next table and figures show the evolution and type of materials, colours and minerals identified until now by the Project Arquiberlab. They were used by the Iberians for decoration of different archaeological materials.
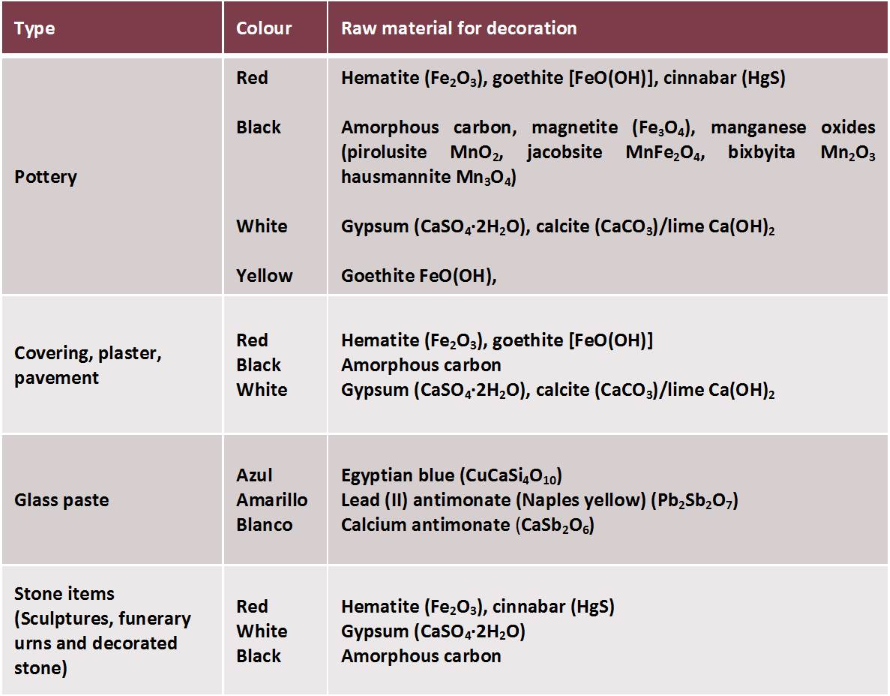 Table 2. Archaeological materials, colours and minerals used by the Iberians.
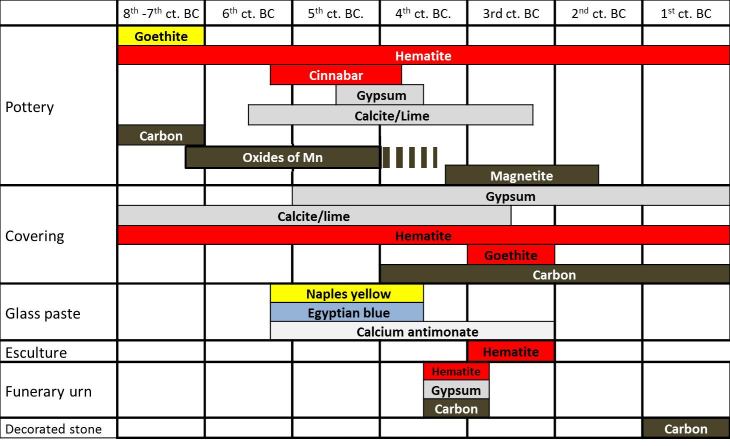
Figure 16. Evolution at Eastern Andalusia and Upper Guadalquivir Valley of raw materials in the decoration of Iberian archaeological materials. Orientalising: 8th-7th ct. BC. Iberian culture: 6th to 1st ct. BC.
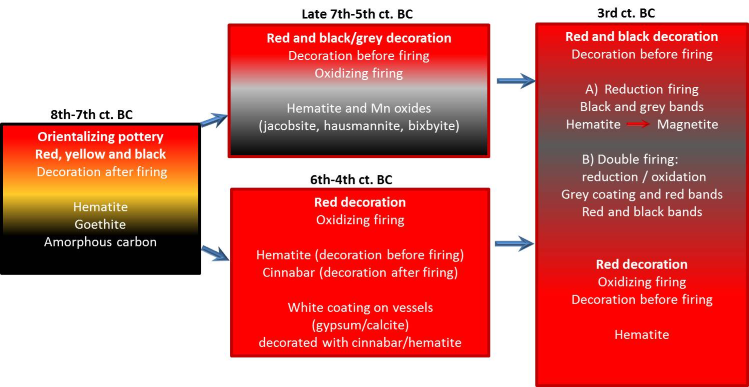
Figure 17. Evolution at Eastern Andalusia and Upper Guadalquivir Valley of raw materials in ceramic decoration. Orientalising: 8th-7th ct. BC. Iberian culture: 6th to 1st ct. BC.
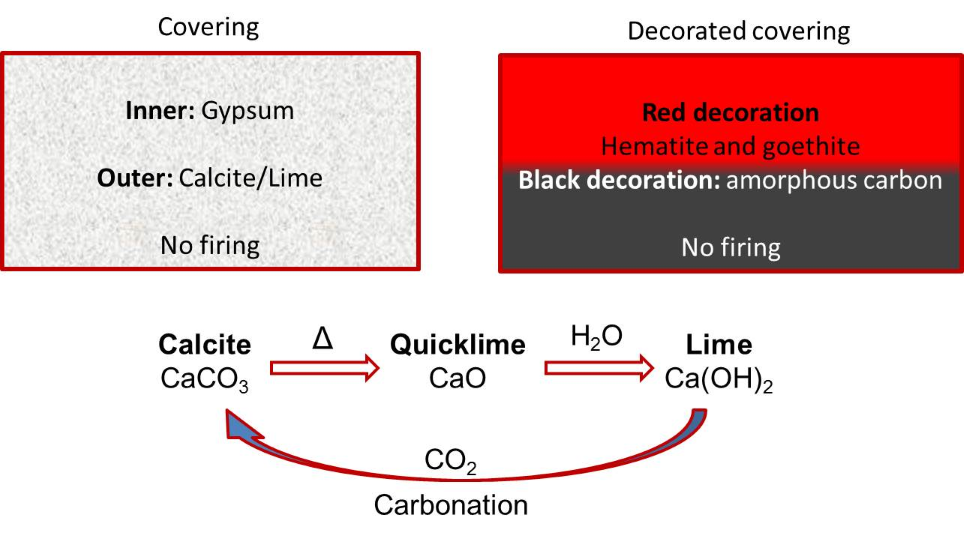
Figure 18. Decoration and raw materials in Iberian coverings. Calcite and lime: manufacturing process and degradation of lime by carbonation